Evaluating our Test Pyramid
Every quarter we run a DX survey to check in on the developer experience at TransferGo. Test efficiency regularly ranks quite low. This asks if the team are happy with the speed and stability of all our automated tests.
When discussing the survey, I provided some specifics, as I've been working in one of our legacy codebases for many years and have a good idea about some of the problems.
My thinking was our test pyramid wasn't balanced. Too many integration and functional tests, not enough unit tests. This is making the suite slow because we have the wrong volume of tests in each layer.
My guild lead asked me to look into our tests. My thinking was a tad subjective, though, so it was time to get some data.
#The assumption
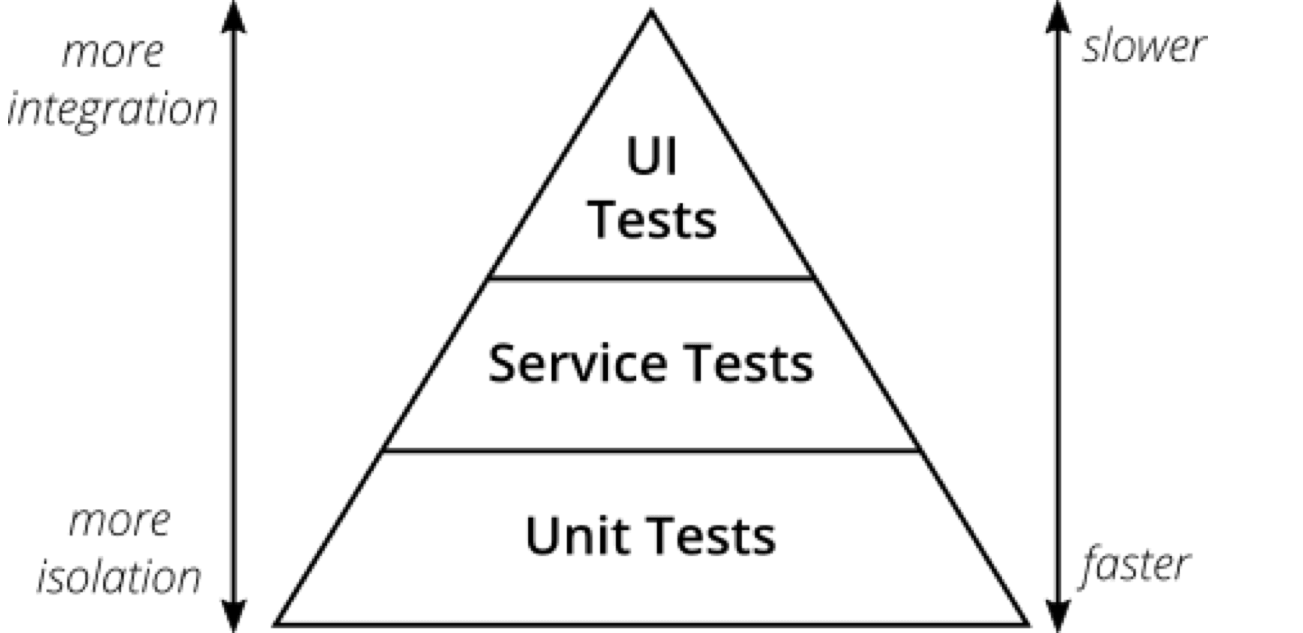
The test pyramid is a simple idea. Lots of unit tests at the bottom, some end-to-end tests at the top. And, in the middle, you have service tests. In our context, these are mostly integration and functional tests.
Tests nearer the top cover more of your application, so they're slower and you have fewer of them. Tests at the bottom are more isolated, run faster, and you have much more.
I feel ours is off.
We have too many tests in the upper layers, and not enough at the bottom. Too many integration and functional tests asserting what a unit test could cover. This is making our test suite slow and brittle.
#Finding our shape
First, the baseline. What does the codebase claim its pyramid looks like? Purely based on where the test files live:
┌─────────────┬────────────┬───────┐│ Tier │ Tests │ % │├─────────────┼────────────┼───────┤│ E2E │ 949 │ 5.3% ││ Functional │ 448 │ 2.5% ││ Integration │ 2,368 │ 13.3% ││ Unit │ 14,031 │ 78.8% │└─────────────┴────────────┴───────┘Wow, 79% unit tests.
That's actually a strong pyramid.
Although, 949 end-to-end tests stand out. We have a dedicated repository for that test suite, so these should be refactored, migrated or removed.
I know for a fact many tests inside the Unit/ folder aren't actually unit tests. So I sat down with Claude Code to write a script to classify every test by what it actually does, not where it lives. But, 79% is a big percentage.
In a short time, the script scanned 17,796 tests and classified each one. This was not comprehensive, by any means, but it was a start to get classification working.
The initial classification came back looking... almost identical.
┌─────────────┬────────────┬───────┐│ Tier │ Tests │ % │├─────────────┼────────────┼───────┤│ E2E │ 949 │ 5.3% ││ Functional │ 634 │ 3.6% ││ Integration │ 2,351 │ 13.2% ││ Unit │ 13,862 │ 77.9% │└─────────────┴────────────┴───────┘Unit tests barely moved. 79% to 78%. The classifier shuffled a few tests between functional and integration, but the unit layer stayed almost the same.
This simply doesn't match what I see when working in this codebase.

I must be missing something...
#What does 'unit' mean?
I refined the classifier to look for signals like:
- Does it inherit from a framework-booting base class?
- Does it call service locators or global helpers?
- Does it import framework internals?
- Does it make HTTP requests?
- Does it seed or otherwise touch a real database?
The tricky part was mock-awareness. A test that mocks the database isn't hitting a real database. But a test that calls the database directly is. The classifier had to tell the difference.
In the end, the analyser wasn't trivial. Multi-phase static analysis with mock-aware heuristics. Building it by hand would have been a bit of a mission. With AI, it was a conversation. Wild.
#The real pyramid
If you toggle between Baseline and Reclassified, you'll see the Unit layer drops from 79% to 70%, but it's still a pyramid. It still looks healthy.
The shape shows a lot. For example, I spotted the top-heavy E2E layer early on. But the shape is just a metaphor. It can't tell you what the tests inside each layer are actually doing.
Ham Vocke puts it in his article on the test pyramid: "write tests with different granularity" and "the more high-level you get the fewer tests you should have."
Because it's not enough for a test to sit in a layer — it needs to actually belong there.
The codebase claims 79% of our tests are unit tests, but only 70% actually are. That's 1,647 tests pretending to be unit tests while booting the framework, hitting the database, or making HTTP requests.
I have numbers now, and they're not insignificant. But knowing tests are mislabelled doesn't tell me what it's costing us.
For that, I need timing.
#Test duration
If classification shows the debt, timing shows the interest.
I ran our main test suite (without E2E tests) with logging and joined the timing data with the classification. This suite takes 5 minutes 14 seconds to run.
Tier Time Tests Avg/test────────────────────────────────────────────────────────Integration (app/db/infra) 3m 51s 2,787 83msFunctional (HTTP requests) 57s 278 203msSociable Unit (real collabs) 5s 3,459 1msSolitary Unit (mocked) 21s 6,674 3msHere's what that 5 minutes 14 seconds looks like:
However, when I run only our unit tests, it takes 1 minute 36 seconds.
Only 26 seconds of that comes from true unit tests. The remaining 1 minute 10 seconds is mislabelled integration and functional tests.
#Why this matters
Unit tests are a fast feedback loop. For engineers and for AI agents. When an agent makes a change, it's good practice for it to run the unit suite to verify it hasn't broken something. That loop needs to be fast.
This already works well in our Profiles bounded context, where the test suite is better maintained and the feedback loops are fast. I can iterate quickly there. In the legacy codebase, it's more of a struggle.
Moving the mislabelled tests to their correct suites wouldn't reduce any coverage, because we wouldn't be deleting a single test. But, it would drop the unit suite to 26 seconds. That's a much leaner feedback loop an agent can heavily use.
But that's just the first step. After that, we can start refactoring the integration and functional tests that should be unit tests. Then we can look at the other test suites in this codebase (like those E2E tests) and ones written in a different test framework. We could rewrite them, deduplicate, and start dropping entire build steps.
Faster feedback for engineers and AI agents. And faster deployments, too.
That's my end goal and why I care about this.
Because I know the impact this has on engineers, and what it costs the business.
#Compounding the cost
Earlier I said: if classification shows the debt, timing shows the interest. Let's compound it.
1 minute 10 seconds doesn't sound like much. But nobody runs the tests once. Engineers (and their agents) run them multiple times a day. So do our build systems. Multiply that across a team for a year, and the numbers get uncomfortable:
That's interest we're paying on this debt every day.
#What this taught me
At first glance, the volume of tests in each layer looked fine. But the question shouldn't have been "how many unit tests do we have?" It needed to be "how many are actually unit tests?"
The whole investigation took a fraction of the time it would have without AI. It helped classify the tests, but more than that, it removed the friction between question and answer. I was able to follow hunches and verify assumptions in real time.
Now, instead of saying:
"The tests feel slow"
I can say:

The classifier isn't perfect. It's an AI-based static analysis, not a manual audit. Some tests, no doubt, will be misclassified.
But I wasn't looking for perfect. I was looking for a signal strong enough to justify further investment, and these numbers give me that.
#Try it yourself!
If something feels off, don't stop at the first hurdle. The pyramid looked fine to me initially. It wasn't until I classified tests by what they actually do, then timed them, that I found the true cost.

I encourage you to follow the thread. AI removes a lot of friction. A hunch became a classifier, the classifier became timing data, the timing became a business case. Each question led to the next, and none of them took long to answer.
Not too long ago, the hunch would have become a Jira ticket, lost in a backlog somewhere.
If you follow yours, reach out and tell me what you find!
Why not start with your test pyramid?